Power Systems Onboarding
Power Systems · New Engineer Onboarding

From Drawing
to Model.

How to actually read a One-Line Diagram and a Panel Schedule — and turn what you see into a correct SKM model. Written for engineers on day one: every step tells you exactly where to look and what to type.

The real source documents are embedded right on this page — the actual study one-line, the engineer's transformer field sheet, the equipment-evaluation report and the manufacturer's rating table. Every number you see is read directly off them.

Read & model a one-line Transformers & breakers Find real breaker data Model the trip unit

Performed in SKM Power*Tools · Worked example: a real low-voltage facility — 12.47 kV → 225 kVA → 208 V — modelled end to end.

Start here · the big picture

How a model gets built, start to finish

Before any detail, here is the whole journey on one screen: you read the one-line, build the system element-by-element in SKM, then run the studies in order. Everything else on this page is a zoom-in on one of these steps. The build order follows the SKM PowerTools workflow. SOURCE E · SKM PTW tutorial

Phase 1 — Build the model on the one-line

You re-create the one-line inside SKM, top to bottom, exactly as you read it.

  1. 1Start a new project. SKM creates a project folder that holds the one-line, the data and every report.
  2. 2Lay out the buses. One Bus per voltage level you found on the drawing — e.g. a 12.47 kV source bus and a 208 V switchboard bus. Name each, set its nominal kV. → reading the one-line
  3. 3Add the utility source. Drop a Utility and connect it to the top bus; enter its voltage, short-circuit kA/MVA and X/R. → Step 1
  4. 4Add the transformer between two buses. Connect its primary to the HV bus and secondary to the LV bus; enter the six numbers. → Step 2
  5. 5Add cables / feeders. A Cable on each branch — size, # conductors, length, material. → branches
  6. 6Add the protective devices. Place each breaker/fuse, pick the real device from the library, set frame, interrupting kA and trip unit. → Step 3 · Step 4
  7. 7Add the loads. A Load or Motor on each panel/MCC bus — kVA or HP, FLA, PF. → panel schedule

Phase 2 — Run the studies, in this order

Order matters: each study assumes the previous one passed.

LF 1 · Load Flow Run it first. Confirms voltages and currents are sensible — catches a swapped voltage or wrong kVA before it poisons everything downstream.
SC 2 · Short Circuit Calculates the bolted fault current at every bus (≈12.5 kA at our 208 V switchboard). The number every breaker is judged against.
EE 3 · Equipment Evaluation Compares each device's interrupting rating against that fault — the pass/fail table. → Step 2B
CS 4 · Coordination (TCC) Set the trip units so the device nearest a fault trips first. → Step 4
5 · Arc FlashWith protection set, the arc-flash study computes incident energy and PPE per IEEE 1584 — the labels that go on the equipment. It is the last study because it depends on every step before it.
The mental modelRead the one-line → rebuild it in SKM bus-by-bus → feed each element its real data → run the studies in order. The rest of this page teaches you exactly what data each element needs and where to find it.
Phase 1 · data

What the model is hungry for

A study model is only as good as the data you feed it. Before opening the software, your real job is to harvest a handful of numbers from the drawings. The right-hand column shows the actual value from our work-along study so you know what "good data" looks like.

The real system we follow on this pageThe values below come from a published low-voltage facility study run in SKM PowerTools. The site is fed from utility (LG&E) at 12.47 kV, stepped down by a 225 kVA transformer to a 208Y/120 V Siemens main switchboard, which feeds branch panelboards. We model that exact system, piece by piece. SOURCE A · e-Hazard SKM study
What the model needsWhere it hides on the drawingsReal value in our study
System voltagesOne-line bus labels12.47 kV → 208Y/120 V
Utility short-circuitNote near the utility symbolIsc 3φ = 3,808 A, X/R = 8.0 @ 12.47 kV
Transformer kVA, V, %Z, X/RTransformer callout / data sheet225 kVA · 12.47 kV–208 V · %Z = 1.80 · X/R ≈ 3.7
Breaker frame, interrupting kA, trip unitOne-line tag, schedule, submittale.g. GE SGDA 400 A, 65 kA (Panel A main)
Cable size, length, conduitOne-line feeder tags / cable scheduleCBL-0001: (2) 500 kcmil Cu, 250 ft
Loads (kVA / HP / FLA)Panel & MCC schedulesTransformer sec. FLA = 624.5 A
Nameplate > Schedule > AssumptionAlways prefer a value read off the actual nameplate or manufacturer submittal. In our study the engineer physically went to site and recorded the transformer kVA, voltages, %Z and primary fuse from the equipment itself — not from a drawing. That is the gold standard. If you must assume, write it down.
Step 1

Reading a One-Line, then modelling it

A one-line ("single-line") diagram collapses all three phases into one line so you can see the path of power from the utility to the load. The diagram below is drawn from our real study. Click each red dot — it gives the actual recorded data and which SKM element it becomes. SOURCE A

~ Utility · LG&E 12.47 kV Isc 3φ 3,808 A · X/R 8.0 Cooper 353C10 · 25 A XFMR 33669 · 225 kVA 12.47 kV – 208Y/120 %Z = 1.80 CBL-0001 (2)500kcmil 250ft SIEMENS MAIN SWBD · 208 V 3φ fault = 12,518 A (12.52 kA) PANEL 1 TR 400A PANEL 3 TR 200A PANEL A SGDA 400A 1 2 3 4 5 6
▲ Redrawn from the real study one-line. Tap a numbered dot.

👆 Click a red dot to see the real recorded data, where it came from, and how to model it.

This is the real thing — the actual study one-line

The clean diagram above is a teaching simplification. Below is the actual one-line / model drawing from the published SKM study. It looks busier, but it is the same logic: source at the top, the red line is the 208 V switchboard bus, and every box hanging below is a panel or load. Scroll inside the frame; open full size to read any box.

Real SKM one-line / arc flash model drawing from the published study
SOURCE APublished SKM PowerTools model one-line — "XYZ Company, Base Project."
  • Top centre & right: the two 
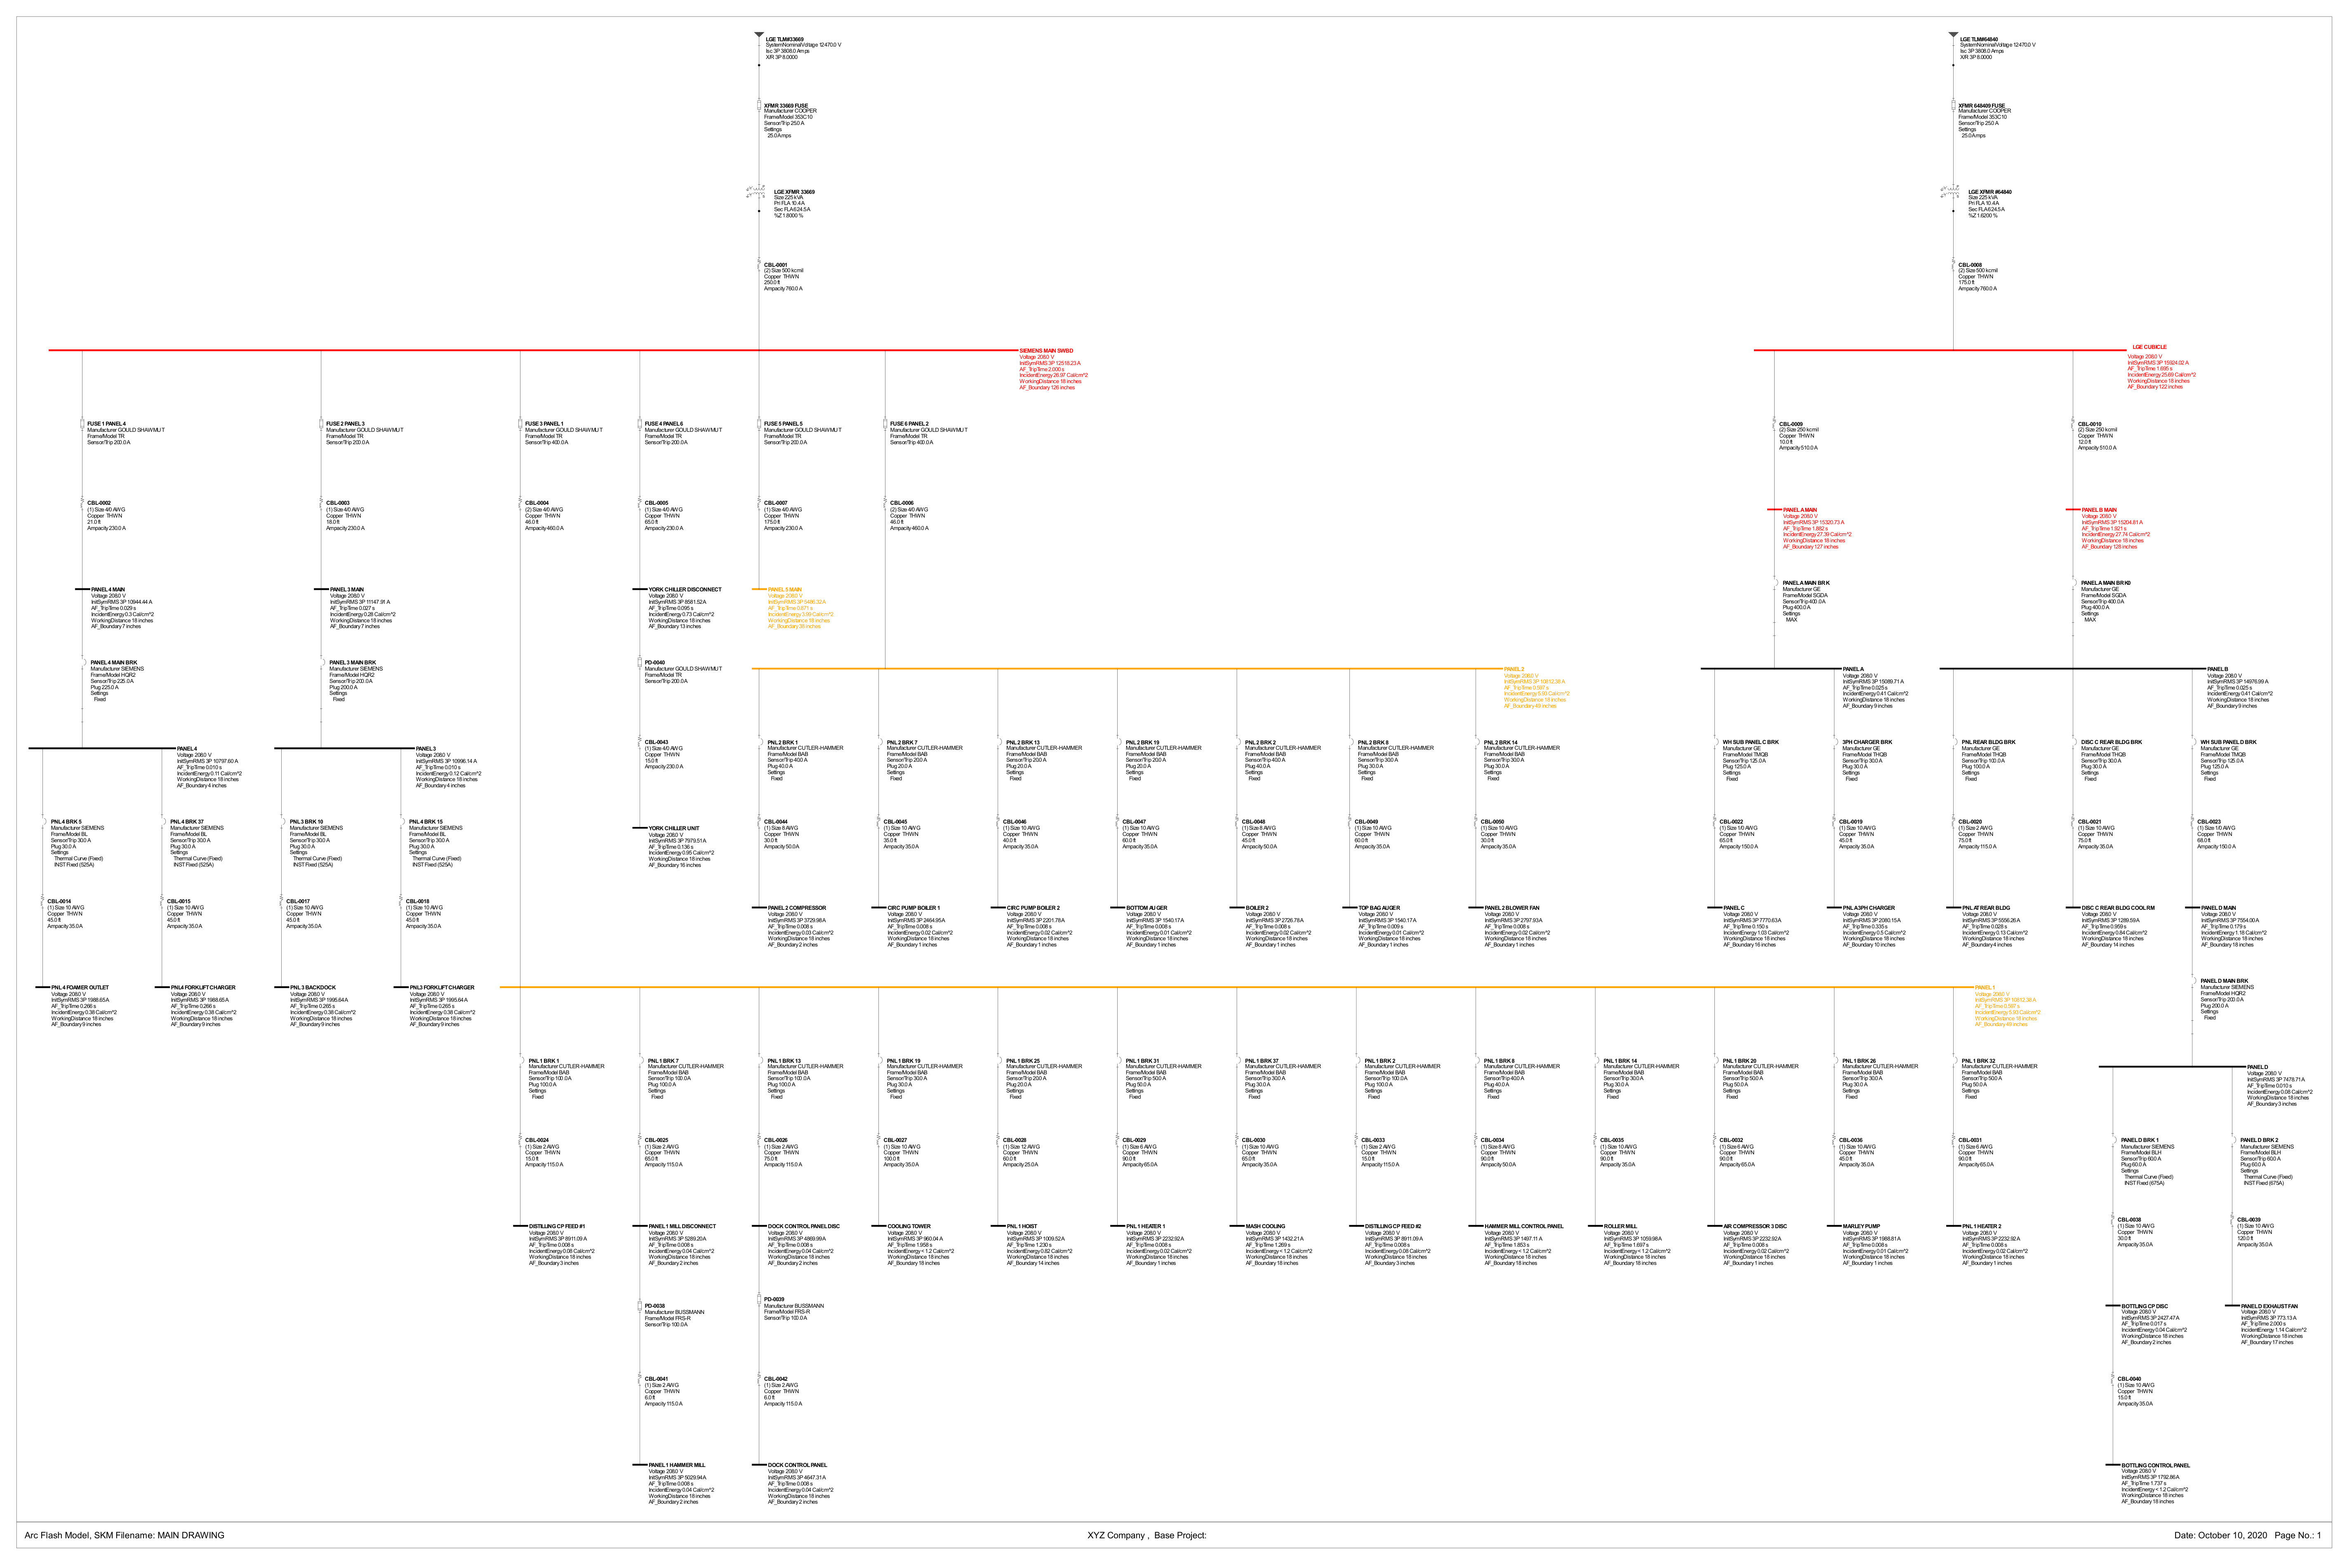
225 kVA utility transformers feeding the site.
  • The long red horizontal line = the 208 V Siemens main switchboard bus — the same bus you modelled above.
  • Each block below = a panel / disconnect / motor, with its calculated fault current and arc-flash result printed next to it.
↗ Open full-size one-line

Read the one-line in this order (every single time)

  1. 1Start at the top — the source. Find the utility and its short-circuit strength (here Isc 3φ = 3,808 A, X/R 8.0). This is your first bus.
  2. 2Follow the line down. Power flows top→bottom. Each device you pass (fuse, breaker, switch) is a protective element; each horizontal bar is a bus.
  3. 3Mark every voltage change. The transformer takes 12.47 kV down to 208 V — a new voltage = a new bus base. Note both voltages and the connection.
  4. 4Name every bus. Here: "SIEMENS MAIN SWBD" at 208 V, then Panel 1, Panel 3, Panel A… each becomes a Bus.
  5. 5Capture the branches between buses. The cable tag (CBL-0001) gives the impedance between the transformer and the switchboard.

How the one-line maps to SKM, element by element

On the one-line you see…In SKM you create…Key fields to fill
Utility source + "Isc 3,808 A, X/R 8.0"Utility componentVoltage, 3φ short-circuit A or MVA, X/R
A horizontal bar (switchboard / panel)BusName, nominal kV
Two stacked circles (transformer)2-Winding TransformerkVA, pri/sec kV, %Z, X/R, connection
A fuse or breaker symbol in the lineBranch with a protective DeviceFrame/sensor, interrupting kA, settings
A feeder tag (e.g. "(2) 500 kcmil, 250 ft")Cable on the branchSize, # conductors, length, material
A panel / motor blockLoad / MotorkVA or HP, FLA, PF

Quick check: the bar labelled "SIEMENS MAIN SWBD · 208 V" becomes which SKM element?

Step 2

Modelling the transformer and the breaker

These two elements set the fault levels for the whole downstream system. We model the actual transformer and breakers from our study, with their real recorded values.

2A · The transformer — six numbers, with the real ones filled in

From the site data sheet for transformer TLM# 33669, here are the exact six things you need: SOURCE A

#FieldReal valueWhere it came fromSKM input
1Rating (kVA)225 kVATransformer nameplateBase kVA
2Primary voltage12.47 kVBus above (utility side)Primary kV
3Secondary voltage208Y/120 VBus below (switchboard)Secondary kV
4Impedance %Z1.80 %Nameplate%Z on transformer kVA base
5X/R ratio≈ 3.7Primary-side data / libraryX/R
6ConnectionΔ – Y-groundedVector group / nameplateWinding config
Real transformer field data sheet recorded on site
SOURCE AThe actual field data sheet the engineer filled in at site — this is where every number in the table above comes from.
  • Row 1 
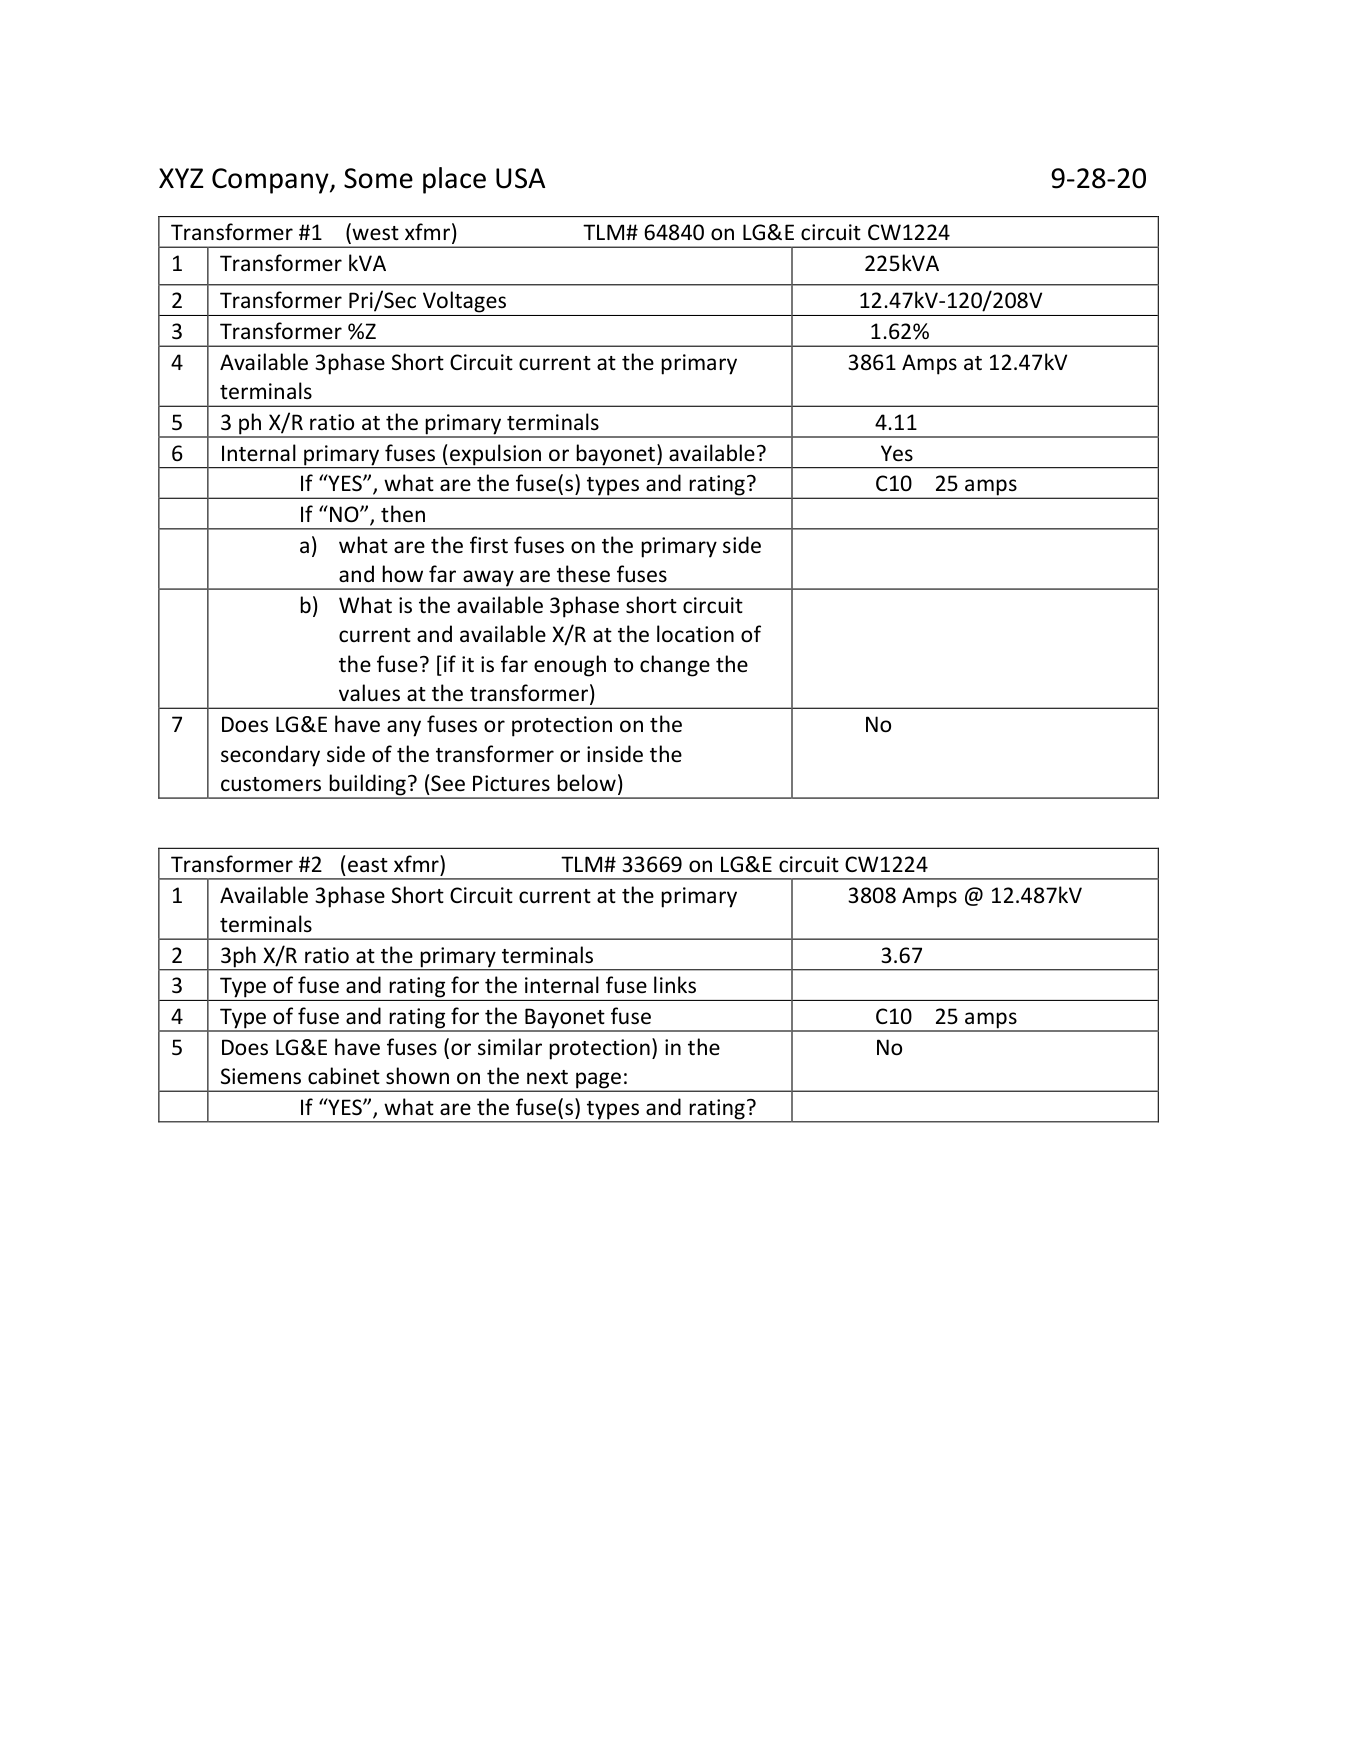
Transformer kVA → 225 kVA; Row 2 12.47 kV – 120/208 V; Row 3 %Z = 1.62 / 1.80%; Row 5 X/R = 4.11 / 3.67.
  • Note it lists the primary fuse C10, 25 amps — that became the primary-fuse device in the model.
↗ Open full-size data sheet
SKM checks your arithmeticEnter kVA + both voltages and SKM auto-computes the full-load amps. In our study the model reports primary FLA = 10.4 A and secondary FLA = 624.5 A for this 225 kVA unit — exactly what 225 kVA at 12.47 kV and 208 V should give. If the FLA the software shows doesn't match your hand-check, a voltage or the kVA is wrong. SOURCE A
Three classic transformer mistakes
  • %Z on the wrong base. Our 1.80% is on the transformer's own 225 kVA. Don't hand-convert unless you know why.
  • Forgetting the connection / grounding. A delta–wye with a grounded secondary changes ground-fault behaviour completely.
  • Swapping primary/secondary voltage. Read the bus above (12.47 kV) vs. below (208 V) — not left/right of the symbol.

2B · The breaker — capture its identity before any settings

A breaker is a branch carrying a protective device. Before any trip setting, record its identity. These are real devices pulled straight from the study's equipment list: SOURCE A

Device (real)Frame / rangeInterrupting ratingCalc. faultResult
GE SGDA (Panel A main)125–400 A65 kA15.32 kAPassed
Siemens HQR2 (Panel 3 main)100–250 A65 kA11.15 kAPassed
Cutler-Hammer BAB (branch)15–100 A10 / 65 kA10.81 kAPassed
GE TMQB (sub-panel)60–125 A42 kA15.09 kAPassed
Real equipment evaluation table from the SKM study
SOURCE AThe real Equipment Evaluation report — every protective device checked against the calculated fault.
  • Column 
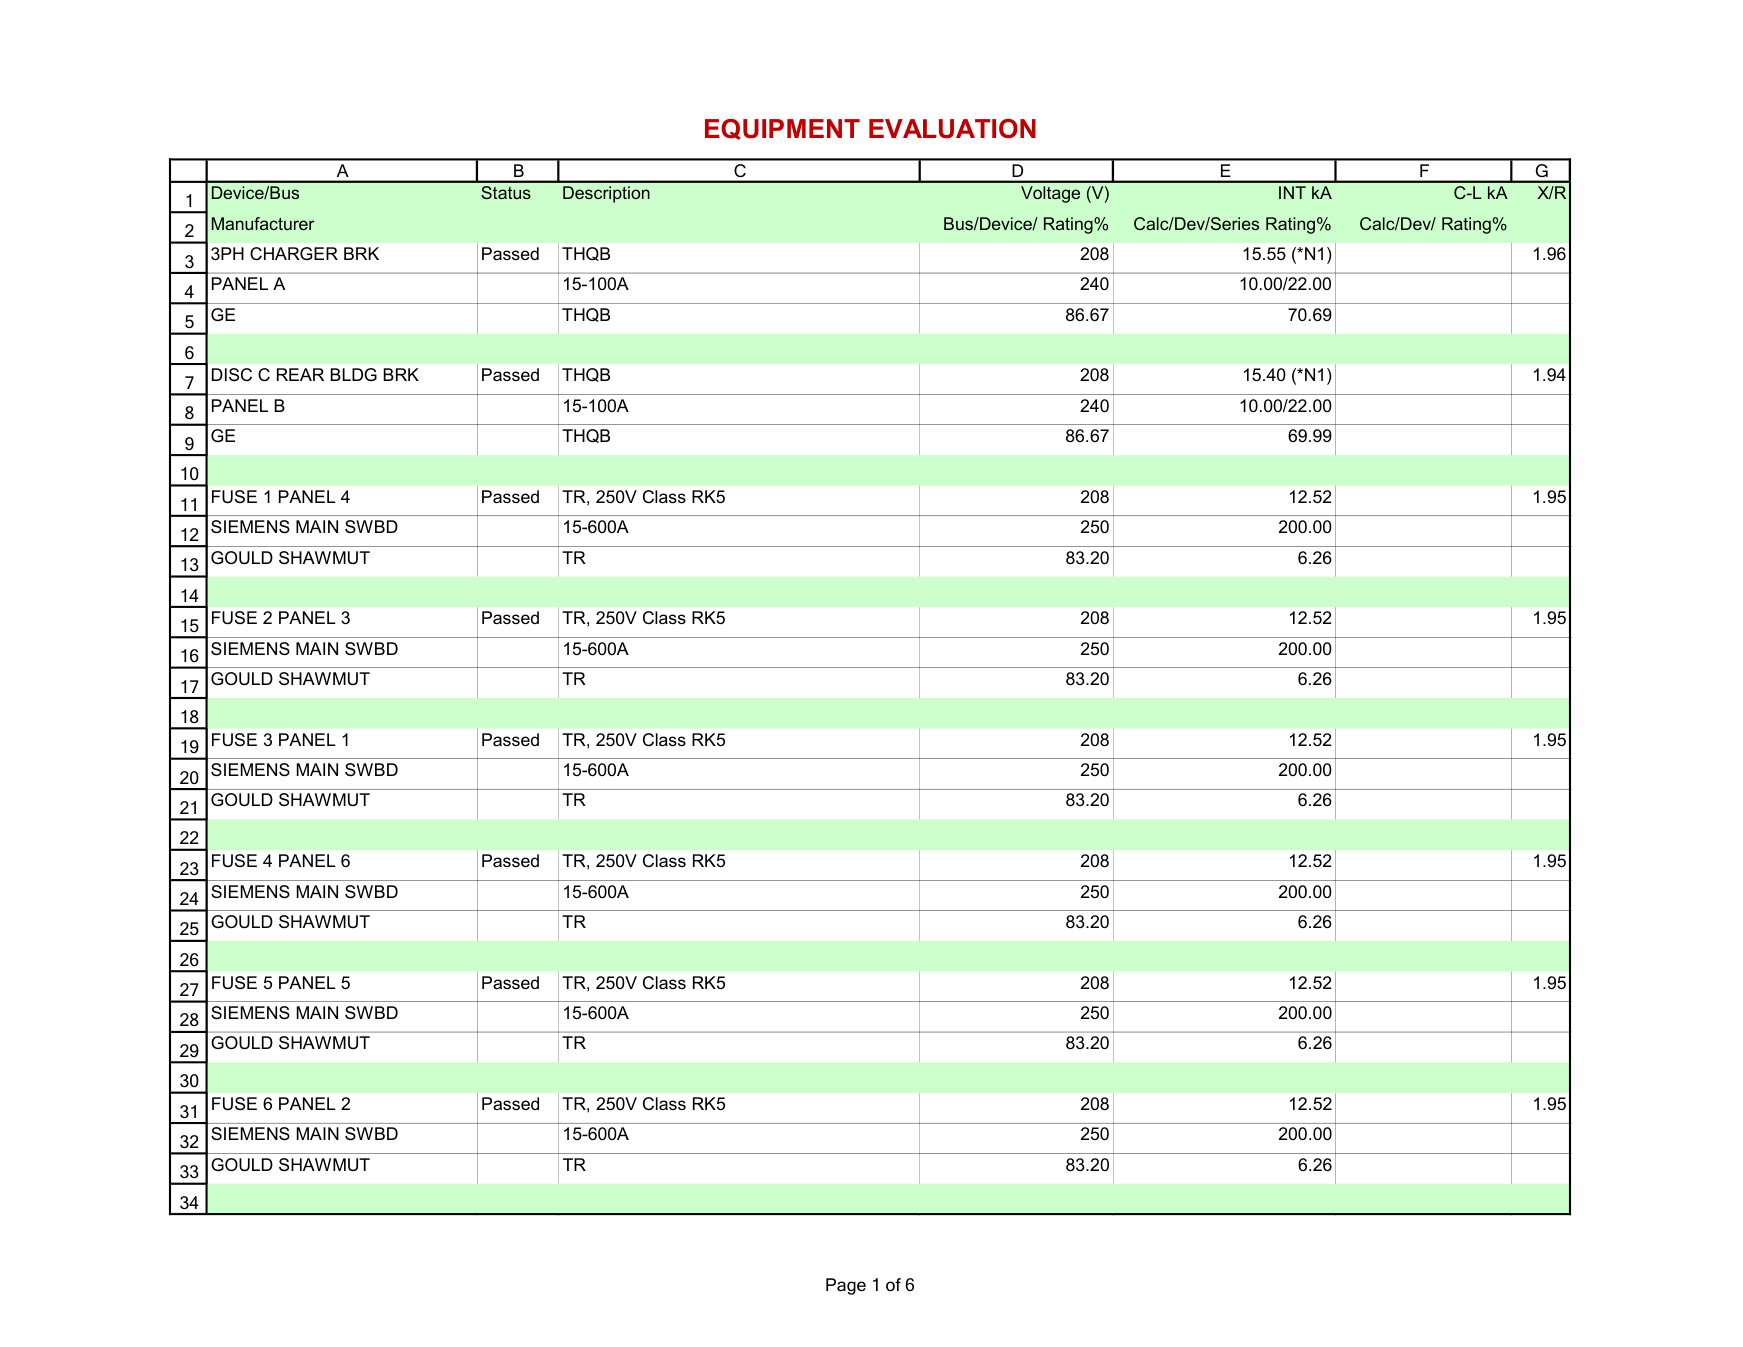
INT kA = the calculated fault; the device's Rating% shows how much of its interrupting capacity is used.
  • Status Passed means rating > fault. This is exactly the check described below.
↗ Open full-size evaluation table
The one check you must never skipAfter the short-circuit run, compare each breaker's interrupting rating against the calculated fault current at its bus. Every device above passes because its rating (65/42 kA) comfortably exceeds the fault (≈11–15 kA). If fault > rating, the breaker is under-rated — a safety finding, not a rounding error. This equipment-evaluation table is half the reason the study exists.
Breaker factSKM fieldEffect in the study
Frame / sensor ampereDevice frame / sensorUpper bound on continuous & trip settings
Interrupting rating (kA)Device interrupting capacityPass/fail vs. calculated fault current
Trip unit / modelDevice library selectionPicks the time-current curve shape

Quick check: the transformer nameplate says %Z = 1.80. The model should…

Step 3

Finding the breaker's real data

A one-line might just say "400 A". That is not enough to model protection. The catalog (type) number on the nameplate or submittal encodes the frame, the interrupting rating, the poles and the trip unit. Learn to decode it — using a real manufacturer catalog.

Where to find the catalog number

  1. 1Equipment submittal / shop drawings — most reliable; lists every device's full type number.
  2. 2Breaker nameplate — the label on the breaker face / escutcheon.
  3. 3Panel schedule — sometimes lists the breaker type in a "device" column.
  4. 4Manufacturer catalog — to decode the string once you have it.

Decode a real type number — Schneider MasterPact NW

Click each block. The meanings and ratings come straight from the manufacturer's MasterPact catalog. (Example: a 2000 A frame, 65 kA, 3-pole drawout breaker with an electronic LSI trip unit.) SOURCE B

NW
frame family
20
frame ampere
H1
performance
5.0
trip unit
Click a block above to decode it.

The real interrupting-rating table (MasterPact NW, Icu at 440 V) SOURCE B

Performance levelIcu @ 440 VCatalog wording — what it's for
N142 kAStandard applications with low short-circuit levels
H165 kAIndustrial sites with high short-circuit levels
H2100 kAHigh-performance for heavy industry
H3150 kACritical applications needing high performance + discrimination
L1150 kAHigh current-limiting capability

Frame ampere code → rated current: NW08 = 800 A, NW10 = 1000, NW12 = 1250, NW16 = 1600, NW20 = 2000, NW25 = 2500, NW32 = 3200, NW40 = 4000 A. The sensor (Ir) for an NW20 is selectable from 1000–2000 A. SOURCE B

Real MasterPact NW interrupting rating table from manufacturer catalog
SOURCE BThe manufacturer's own characteristics page. The table above is read straight off this.
  • Find the row 
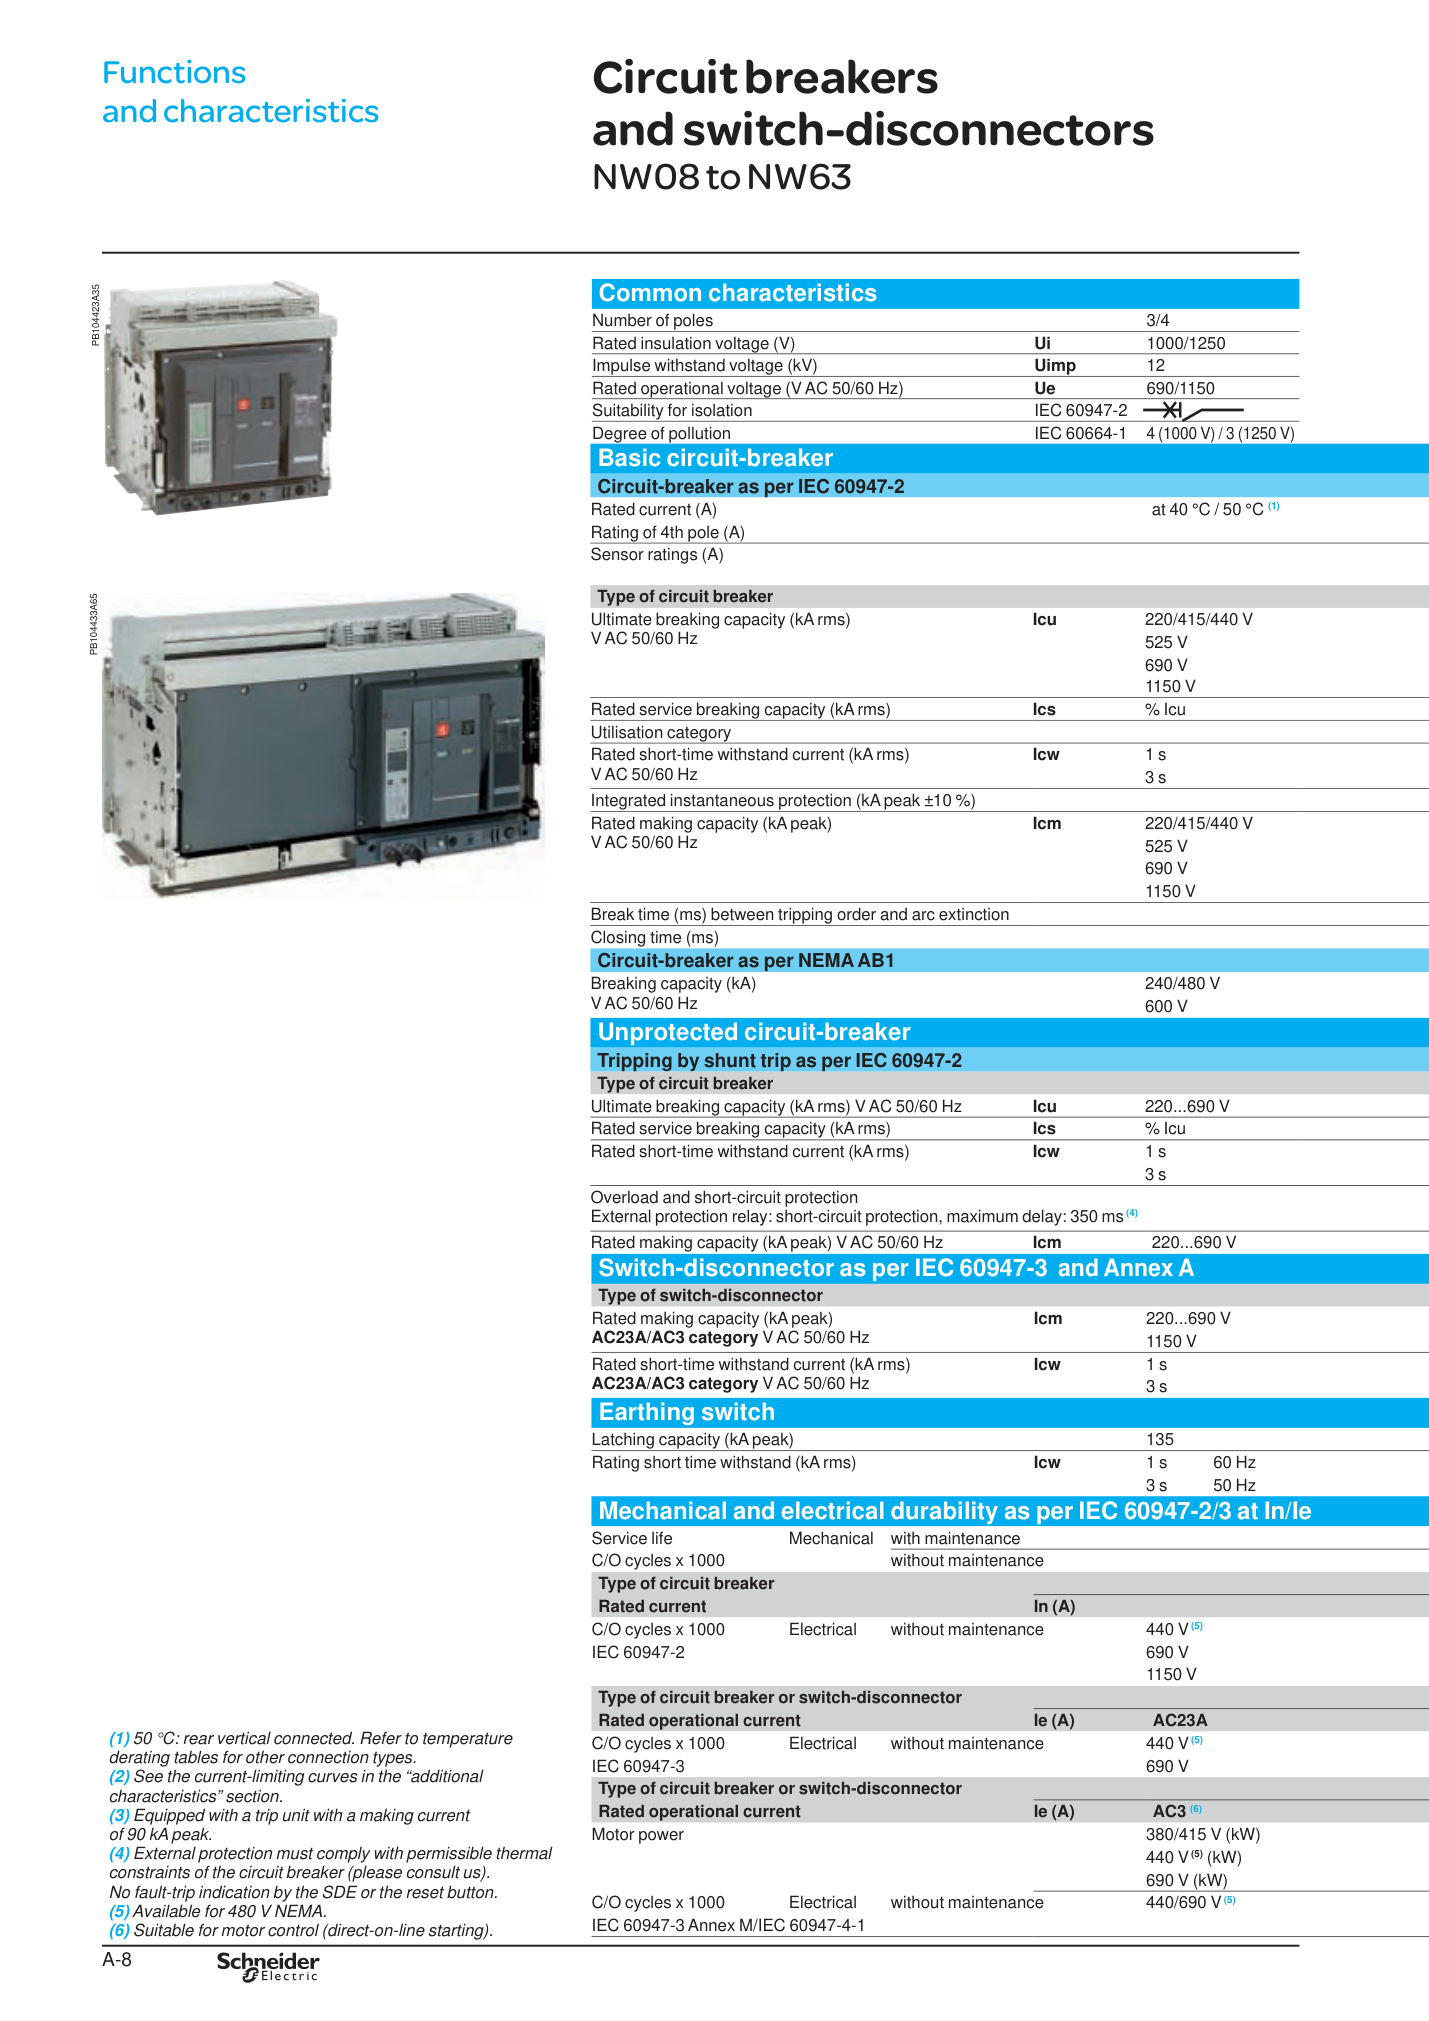
Ultimate breaking capacity Icu at 220/415/440 V → the values 42 / 65 / 100 / 150 kA line up under N1 / H1 / H2 / H3.
  • The sensor-rating row shows the selectable In for each frame.
↗ Open full-size catalog page
The general pattern (most LV breakers follow it)Frame family → frame ampereperformance / interrupting level (N/H/L) → poles / connection → trip unit + sensor/rating plug. Other brands use different letters — the GE SGDA and Siemens HQR2 from Step 2 encode the same four ideas — but the logic is identical.
Don't confuse frame, sensor and tripAn NW20 = 2000 A frame can carry a 1000 A sensor with long-time pickup at 0.8, giving a continuous trip of ~800 A. Three different numbers — keep them straight or your coordination curve sits in the wrong place.

Quick check: in MasterPact NW, the performance code (N1 / H1 / H2 / L1) primarily tells you the breaker's…

Step 4

Modelling the trip unit

The trip unit is the "brain" of an electronic breaker. Modelling it = telling SKM which protection functions exist and what each is set to. Modern units are described by the letters L S I G. The setting ranges below are the real adjustable ranges from a Micrologic electronic trip unit instruction bulletin. SOURCE C

L Long-Time

Protects against sustained overload — "the wire is slowly cooking."

Ir = long-time pickup (continuous current) 0.4 – 1.0 × In

tr = long-time delay (how long it tolerates overload)

S Short-Time

Catches downstream faults but waits a beat so the breaker closer to the fault trips first (selectivity).

Isd = short-time pickup 1.5 – 10 × Ir

tsd = short-time delay (set in 0.1 s steps)

I Instantaneous

No intentional delay — trips immediately on a big fault to protect the breaker itself.

Ii = instantaneous pickup 2 – 15 × In

G Ground-Fault

Senses current returning through ground — currents a phase device would miss.

Ig = ground pickup   tg = ground delay (0.1 s steps)

Read the trip unit suffix5.0 / 5.0P = LSI (no ground). 6.0 / 6.0P = LSIG (adds ground fault). So a "Micrologic 6.0" breaker needs the G function modelled; a "5.0" does not. The catalog number from Step 3 told you which one you have. SOURCE C

How to model it in SKM — the workflow

  1. 1Pick the device from the library. Match the manufacturer + trip unit family. This loads the correct curve shape.
  2. 2Set the sensor / plug rating In first. All the % settings are relative to In.
  3. 3Enter each segment: LTPU & LT-delay, STPU & ST-delay, Instantaneous. An electronic device is essentially these 5 segments (+ ground).
  4. 4Add the Ground function if present. Create a Ground function, set pickup/delay, and point its sensing at the neutral/residual as designed.
  5. 5Read it off the Time-Current Curve (TCC). Each setting moves a curve segment. Drag-adjust is allowed, but type the real submittal values — don't eyeball.
Trip unit dialSKM curve segmentTypical setting source
Ir (long-time pickup)LTPUContinuous load / cable ampacity
tr (long-time delay)LTDCoordination study
Isd (short-time pickup)STPUSelectivity with downstream
tsd (short-time delay)STDSelectivity / withstand
Ii (instantaneous)InstantaneousEquipment withstand
Ig / tg (ground)Ground functionGround-fault protection scheme
Settings come from the study, not the factoryPer the manufacturer bulletin, units ship with long-time pickup at 1.0 and everything else at the lowest setting / off. The whole point of the coordination study is to choose these settings. Model the as-set (or proposed) values, and note where each came from. SOURCE C

Quick check: a breaker's trip unit is a "Micrologic 5.0". Which function do you not need to model?

Companion drawing

Reading a Panel Schedule

If the one-line is the skeleton, the panel schedule is the muscle — it lists every circuit on a panelboard. The example below mirrors a real published 208Y/120 V panelboard schedule (a public infrastructure project). Click a column header to see what it means and how it feeds the model. SOURCE D

CKT ▾ Load Description ▾ Load (kW/VA) ▾ Breaker ▾ Poles ▾ Phase ▾ LF ▾
1Runway Regulator R17.5 kW70 A2A·B0.8
3Runway Regulator R27.5 kW70 A2B·C0.8
5Field Lighting Control1.2 kW20 A1A1.0
7SPARE20 A1C
9SPACE

👆 Click a column header above.

Real published panelboard schedule (VAULT, 208Y/120V) from a public infrastructure project
SOURCE DThe actual panelboard schedule the interactive table above is built from — a public-domain electrical plan sheet.
  • Header strip: 
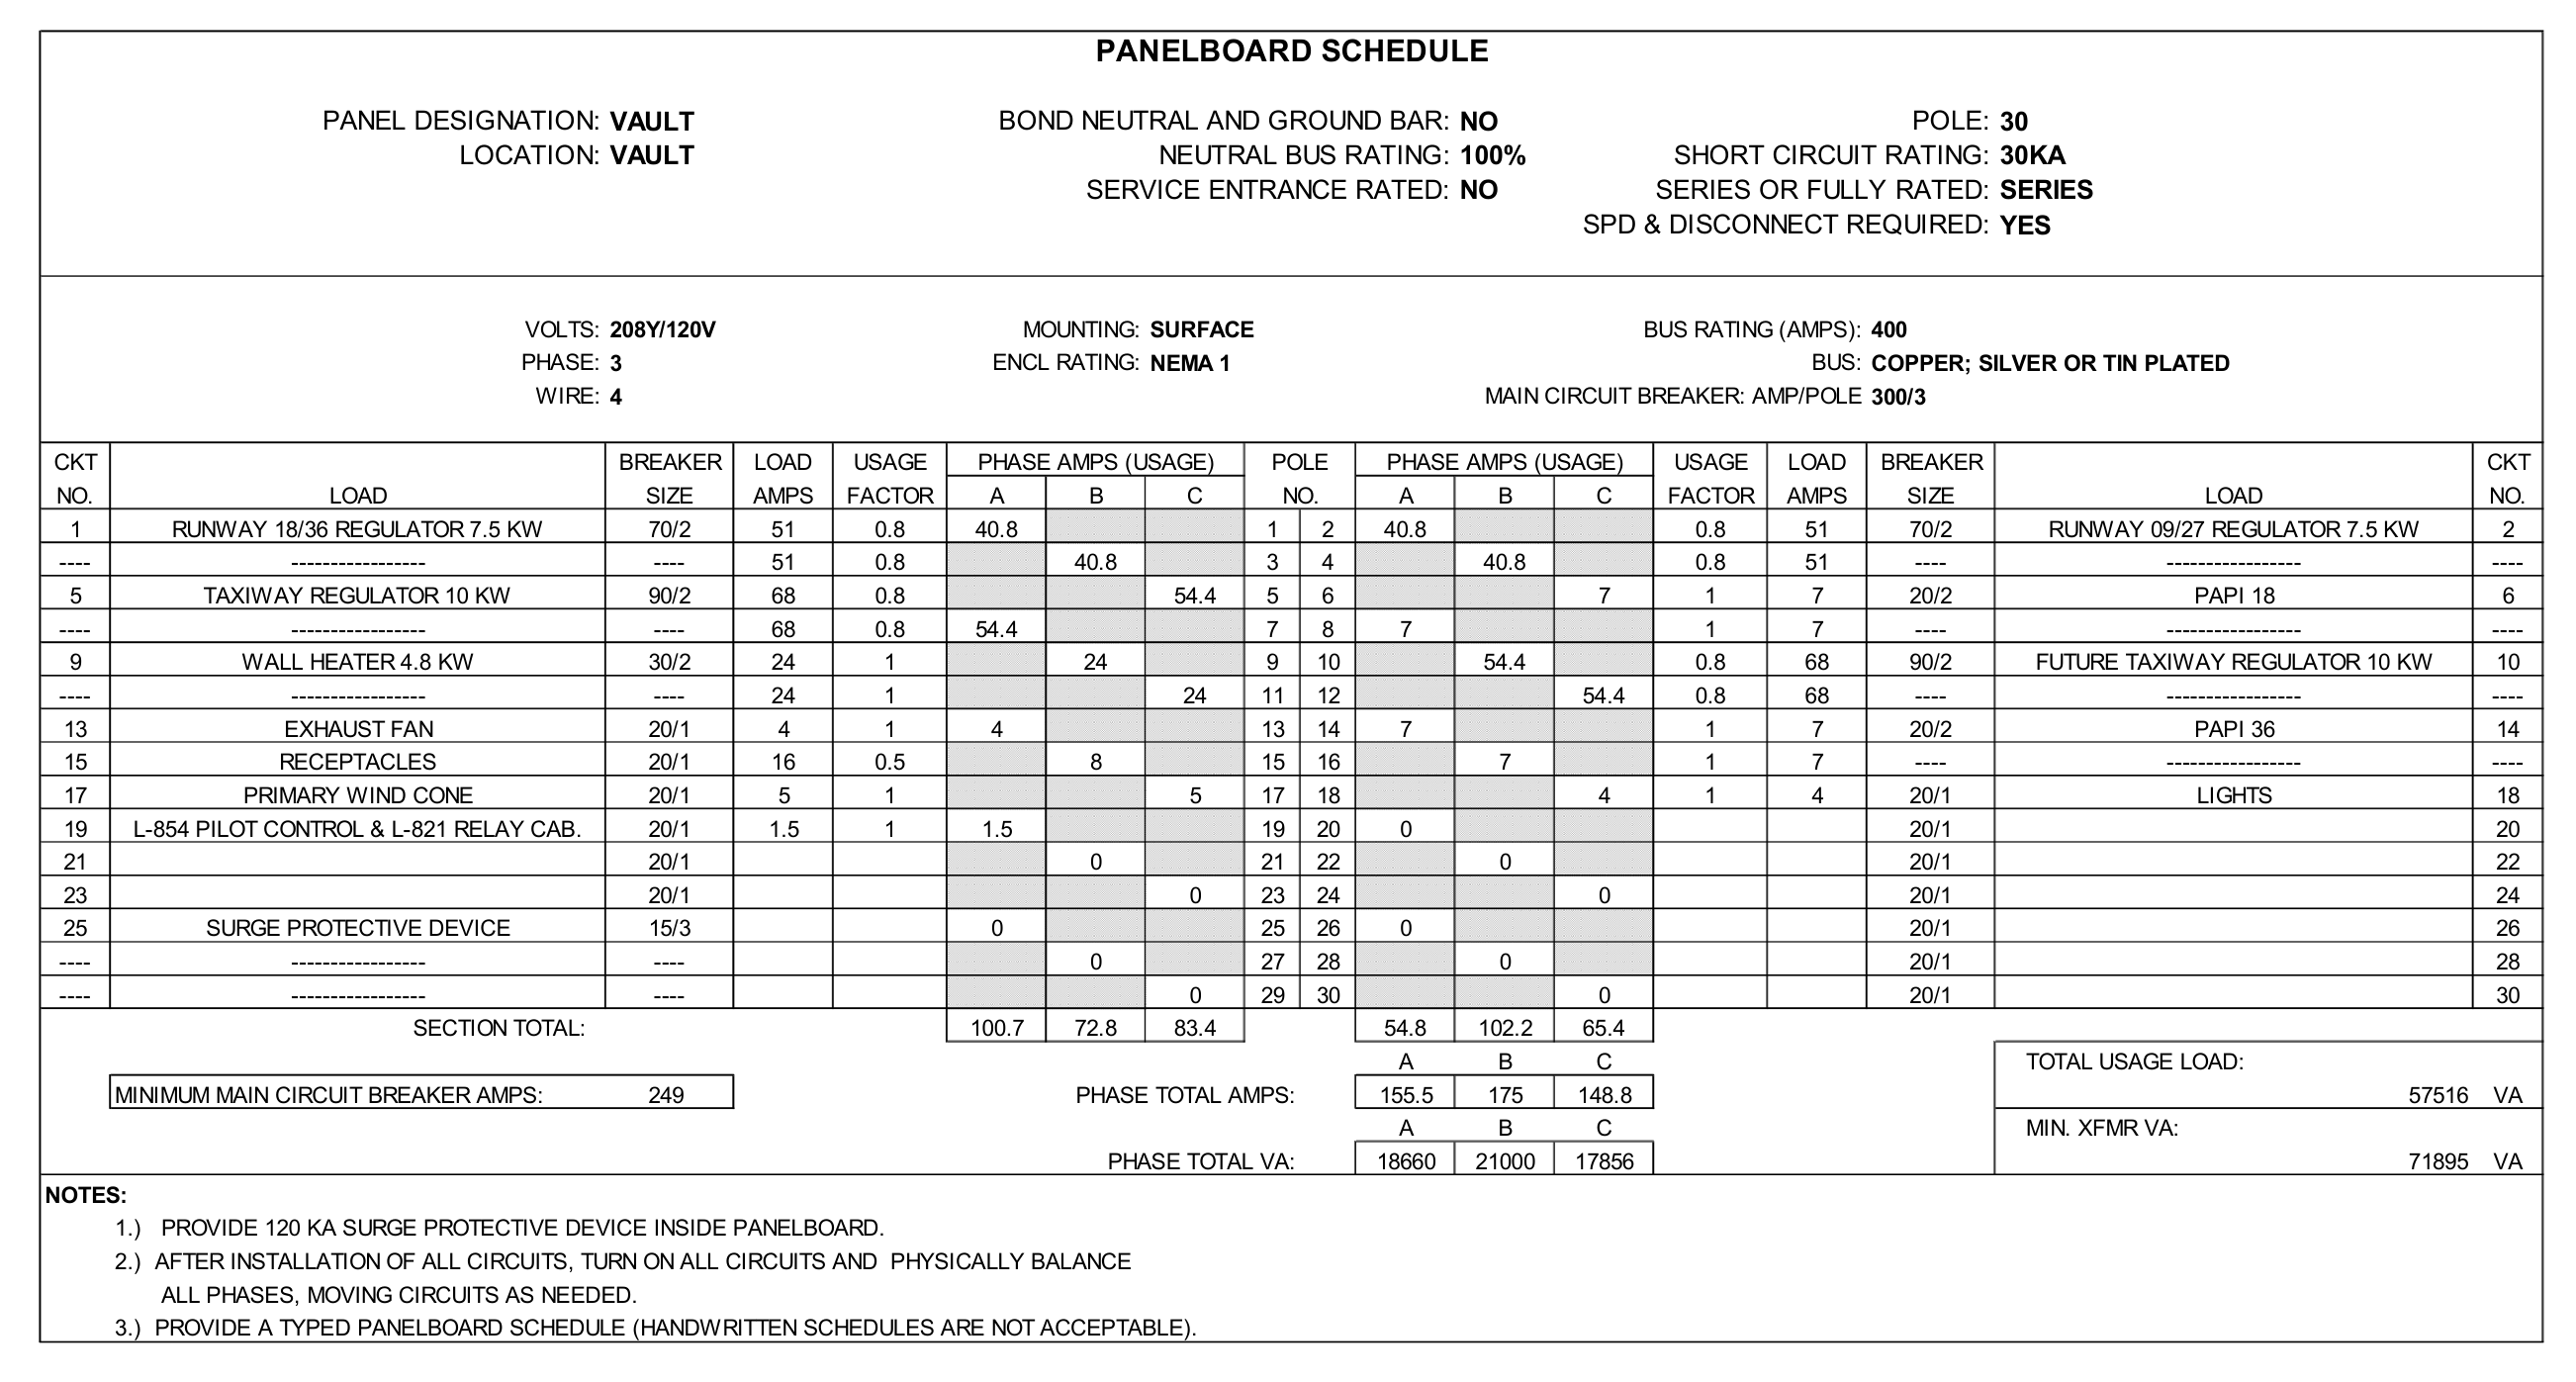
VOLTS 208Y/120V, BUS RATING 400, SHORT CIRCUIT RATING 30 kA, MAIN CIRCUIT BREAKER 300/3 — read these before any circuit.
  • Left/right circuit columns: Runway Regulator 7.5 kW → 70/2 at USAGE FACTOR 0.8, exactly the row you explored above.
  • Bottom rows total the load per phase (A / B / C) — that balance is what feeds load-flow.
↗ Open the full plan sheet (also shows a real bonding / earthing one-line)
Header block you must read firstAbove the circuit list, the real schedule states: panel name VAULT, voltage 208Y/120 V, 3Ø 4W, bus 400 A, main breaker 300 A / 3-pole, plus the AIC rating. These define the panel's Bus and its main device — read them before any individual circuit. SOURCE D
SPARE vs SPACE — not the sameA SPARE is an installed breaker with nothing connected (capacity exists). A SPACE is an empty slot with no breaker at all. Both carry ~0 load, but they say very different things about future capacity.

What the panel schedule feeds in the model

Phase 1 · hands on the software

Build it in SKM — click by click

Now the actual mouse-and-keyboard sequence. This mirrors the official SKM PowerTools build workflow; the goal is to re-draw the one-line you read into the software, then feed each symbol its real data. SOURCE E

The build sequence

  1. 1New project. Start a new project — SKM automatically creates a project folder that stores the one-line drawings, the data files and the reports together. Name it for the site.
  2. 2Drop your buses. Use the New Bus tool to place one bus per voltage level. You'll get BUS-0001, BUS-0002… rename them to match the drawing ("12.47 kV Source", "208 V SWBD") and set each bus's nominal voltage.
  3. 3Add the Utility. Click the New Utility icon, drop it, and drag its connection point onto the top bus — when it connects, the open circle closes. Open its editor and enter voltage, 3φ short-circuit (3,808 A), and X/R (8.0).
  4. 4Connect the transformer between two buses. Drop a New Transformer with its primary on the 12.47 kV bus and secondary on the 208 V bus. In the Component Editor impedance sub-view, type kVA, both voltages, %Z (1.80), X/R and the connection — SKM returns the FLA.
  5. 5Run the cables. Add a New Cable off a bus and set size, # conductors per phase, length and material ((2) 500 kcmil, 250 ft). Tip: when you drop a load onto a cable end, SKM auto-inserts a hidden node-bus — that's normal, it behaves like a bus.
  6. 6Place the protective devices. Add each breaker/fuse on its branch, then pick the matching device from the library (the catalog number tells you which). Enter frame/sensor, interrupting kA, and the LSIG trip settings.
  7. 7Hang the loads. Drop a Load or Motor on each panel/MCC bus and enter kVA or HP, FLA and PF.
  8. 8Turn on a Datablock. Attach a Datablock so the one-line shows live input data and, later, study results right on the drawing.
Two habits that save hours① Build and name buses first — every other component just connects between buses, so getting them right up front prevents rework. ② After each transformer, sanity-check the FLA SKM returns against a hand calc before moving on.

Then run the studies — in order

With the model built, run the studies from the study menu. Each one builds on the last, so respect the order:

OrderStudy (SKM module)What it answersYou're checking…
1Load Flow (DAPPER)Bus voltages, branch currentsDid I wire it right? Any voltage way off?
2Short Circuit (DAPPER)Bolted fault current at every busHow hard can each bus fault? (≈12.5 kA @ 208 V)
3Equipment EvaluationDevice rating vs. faultIs every breaker rated above its fault?
4Coordination / TCC (CAPTOR)Trip-curve selectivityDoes the nearest device trip first?
5Arc FlashIncident energy, PPE, boundaryWhat PPE label goes on the gear?

In SKM the load-flow and short-circuit pair are launched together from the balanced-system (DAPPER) studies; equipment evaluation, coordination and arc flash are their own study runs.

Your first solo exerciseOpen SOURCE A, find the transformer field sheet at the back, and build this exact 225 kVA system from scratch following steps 1–8. Run load flow then short circuit. If you get ≈12.5 kA at the 208 V switchboard, your model is correct — you've just reproduced a published study end to end.
Take it to site

One-page field checklist

Print this. Tick it off as you harvest data from each drawing — when every box is checked, you can build the model with confidence.

From the one-line

From the panel / equipment data

If you remember one thingRead top-down, name every bus, capture six numbers per transformer, and never enter a breaker without its interrupting rating. Everything else builds on that.
Traceable

Real reference documents

Everything on this page is traceable. Open these public documents and find the exact numbers used above — that is the best way to learn what real study data looks like.

SOURCE A Worked low-voltage facility study (SKM PowerTools)

The 12.47 kV → 225 kVA → 208 V system, the equipment-evaluation table (GE SGDA, Siemens HQR2, etc.), the cable and the recorded transformer data all come from this published example study report.

e-hazard.com — Arc-Flash-Study-Report-Example.pdf

SOURCE B MasterPact NT/NW power circuit breaker catalog

The type-number decode, the N1/H1/H2/H3/L1 performance levels and their kA ratings, the frame-ampere table (NW08–NW40) and sensor ranges are taken from the manufacturer catalog.

srentp.com — Masterpact NW & NT Catalogue.pdf

SOURCE C Micrologic electronic trip unit instruction bulletin

The LSIG functions and the adjustable setting ranges (Ir 0.4–1.0×In, Isd, Ii, Ig, factory defaults) come from the trip-unit instruction bulletin.

download.schneider-electric.com — MicroLogic 5.0P/6.0P Instruction Bulletin

SOURCE D Public 208Y/120 V panelboard schedule

The panel-schedule format and the example circuits (208Y/120 V, 400 A bus, 300 A main, runway-regulator loads at 7.5 kW / 70 A / 0.8 LF) mirror a public infrastructure project's panelboard schedule.

apps1.dot.illinois.gov — Illinois DOT panelboard schedule

SOURCE E SKM Power*Tools (PTW) tutorial

The build sequence (new project → buses → utility → transformer between buses → cables → devices → loads) and the study order (load flow → short circuit → equipment evaluation → coordination → arc flash) follow the official PTW tutorial workflow.

skm.com — Power*Tools for Windows Tutorial (PDF)
How to use these in trainingHave each new engineer open SOURCE A, find the transformer data sheet at the back, and rebuild the 225 kVA transformer in SKM from scratch. Then run a short-circuit and confirm they get ≈12.5 kA at the 208 V switchboard — the same answer the published study got. That single exercise covers everything on this page.